This example targets fiber-reinforced composite material which is oriented in one direction, and shows a series of flow of numerical material test, material constant identification, and macro structural analysis.
Analysis Model
Micro model of composite material
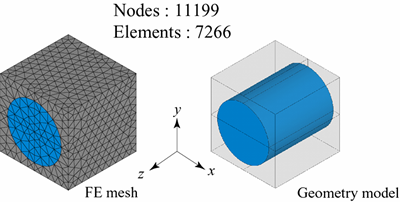
Composite material has the geometrical data of the 50% volume fraction of fibers as shown in Figure 1. For each area, there are defined viscoelastic material properties to the matrix and rigid elastic material properties to the fiber, which is assumed to be carbon fiber.

Figure1: Micro model of composite material
Analysis Results
The identification results and the results of the stress relaxation test in uniaxial direction
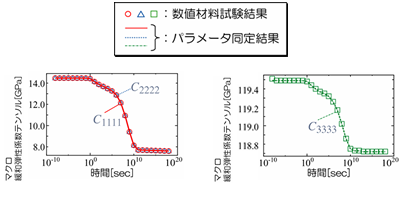
Figure 2 shows the relaxation elastic modulus characteristics of the macro-scale that is obtained from the stress relaxation test in uniaxial direction. You can see the state in which anisotropy is remarkable corresponding to macro response by oriented rigid fibers in z direction (3 directions). The results of curve fitting by anisotropic viscoelastic constitutive law [1,2] which is implemented in CMAS are also shown as solid lines in the same figure .

Figure 2: The results of stress relaxation test in the uniaxial direction (discrete points) and its identification results (solid line)*
(*It also evaluates the response of shear test in practice)
Analysis results and macro structural analysis model composed by composite material
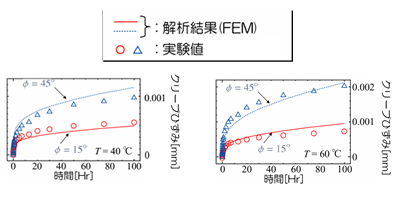
Figure 3 is a macro model which simulates the three-point bending test of the macrostructure using anisotropic viscoelastic material obtained by the above analysis. Evaluating the response creep strain with constant load value holding 100 hours. Analyses were performed to a total of 4 cases: fiber oriented at 45 ° with respect to the longitudinal; fiber oriented at 15 °with respect to the longitudinal; ambient temperature of 40℃; and ambient temperature of 60 ℃. Figure 4 shows these results.
It can verify the anisotropy is taken into account by the fact that differences in fiber orientation angles have affected the analysis results. Also, you can see the validity of the multi-scale analysis results from the comparison with the experimental results.

Figure3: Macro structural analysis model composed by composite material of figure 1.

Figure 4: Macro structural analysis results of CMAS (discrete points) and actual test results (solid line)
| 【Reference】 [1] HIRAYAMA Norio, TERADA Kenjiro: Calculation of anisotropic non-linear material properties by numerical material test, Manufacturing with CAE, CYBERNET SYSTEMS CO.,LTD, Vol.6、p.10~12、2009 (Japanese only) [2] Transactions of the Japan Society of Mechanical Engineers Series A, Vol. 75 (2009), No. 760, p.1674-1683 |
Analysis Types
Structural Analysis、Multiscale Analysis、Numerical Material Test、Viscoelastic Analysis
