Introducing the example of creep homogenization analysis on the composite material that consists of a resin which has the creep characteristics and fiber that is an elastic body and oriented at ±30°. In addition, identifying the material properties value of the anisotropic creep using optimization based on the material test data of these.
Analysis Model
- Numerical material test with constant load performed on micro-model shown in Figure 1 and obtaining creep material characteristics in three uniaxial directions and three pure shear directions respectively.
- Performing identification of anisotropic creep material property value using optimization based on this material test data.
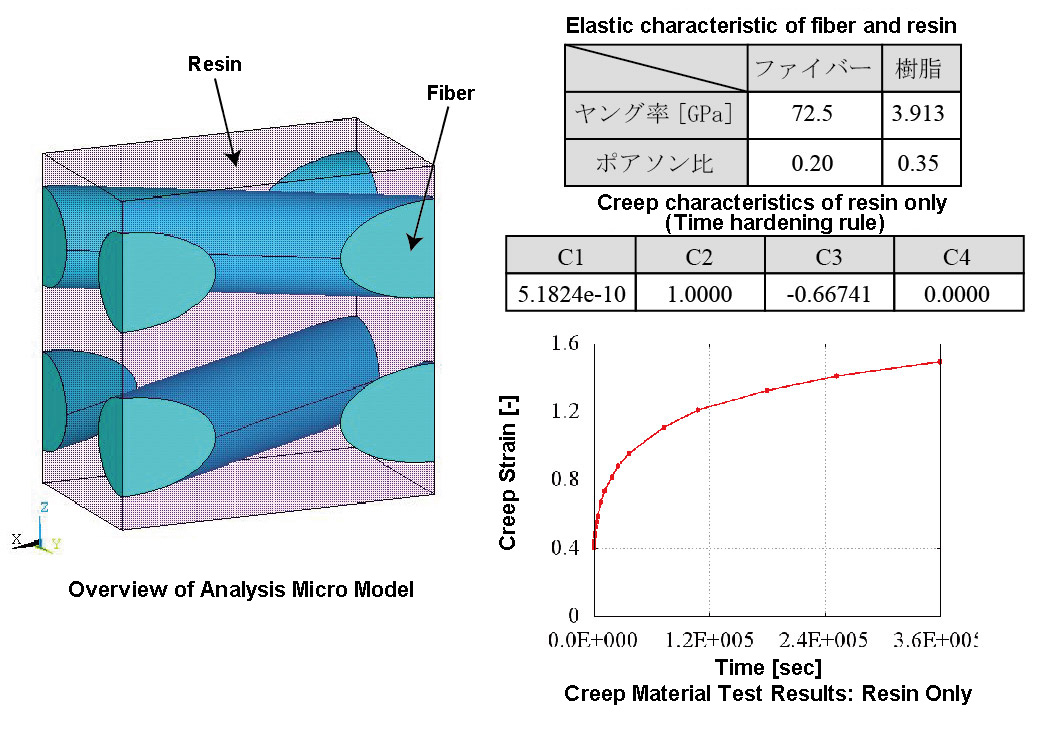
Figure 1. Overview and Constituent material properties value of composite material model
Analysis Results
Material Test Results
Figure 2 shows the creep material characteristics of six directions obtained in the numerical material test. You can see the state which has the "anisotropy" that characteristics are different in all directions. Also, looking at Figure 2 which shows the analysis results of d) xy direction pure shear test, it does not show the creep characteristics compared to the other directions since the fibers oriented in the in-plane direction are mainly responsible for the load. In CMAS, these complex behaviors of heterogeneous materials can be observed conveniently in a virtual environment without relying on actual costly tests.
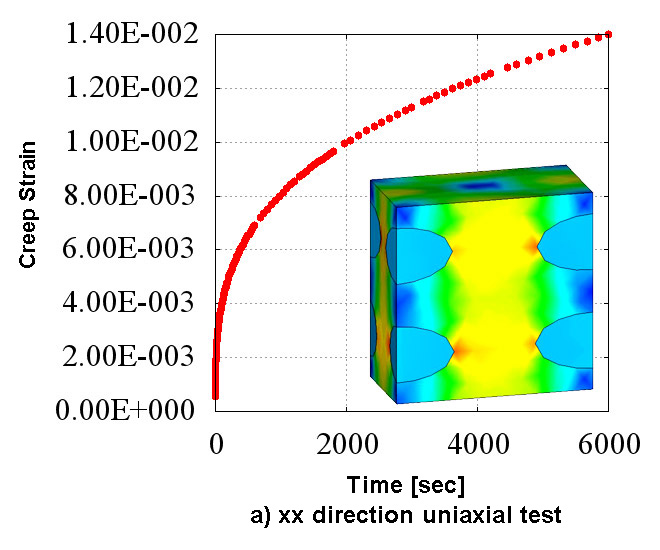
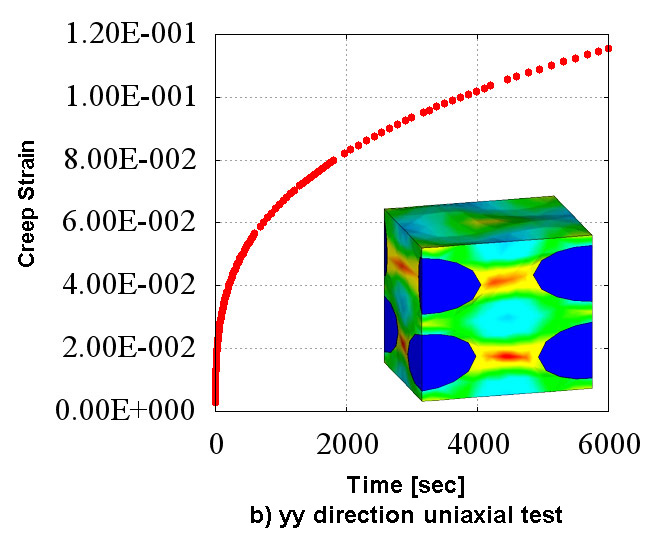
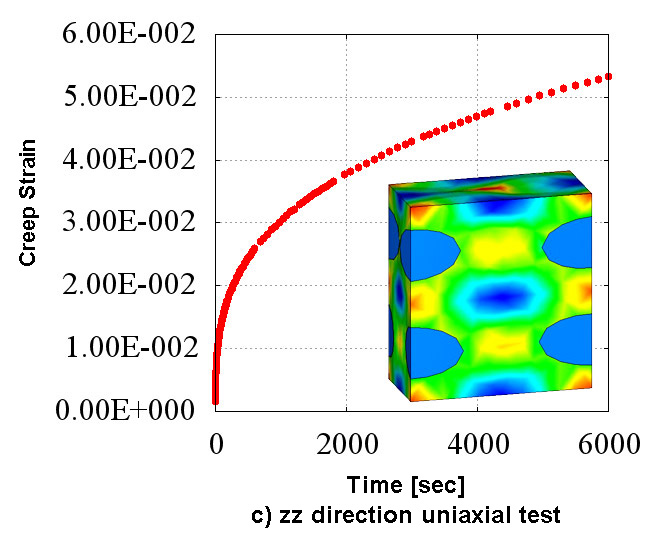
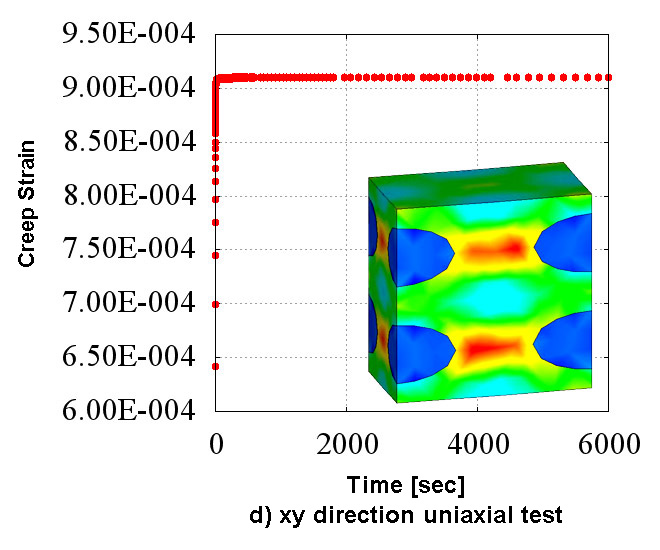
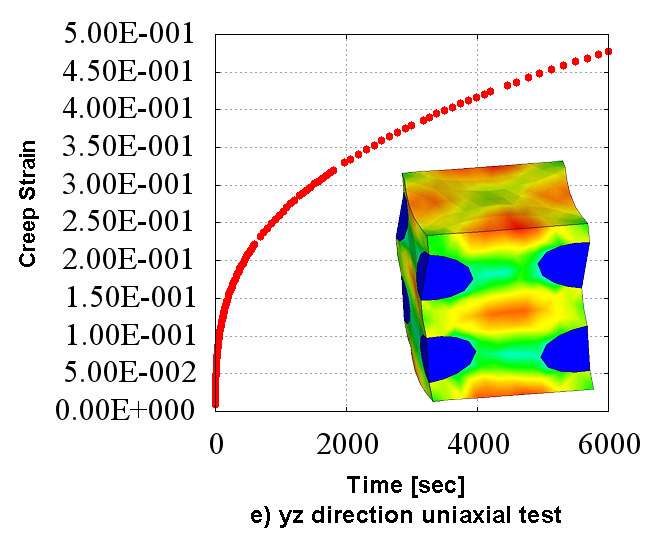
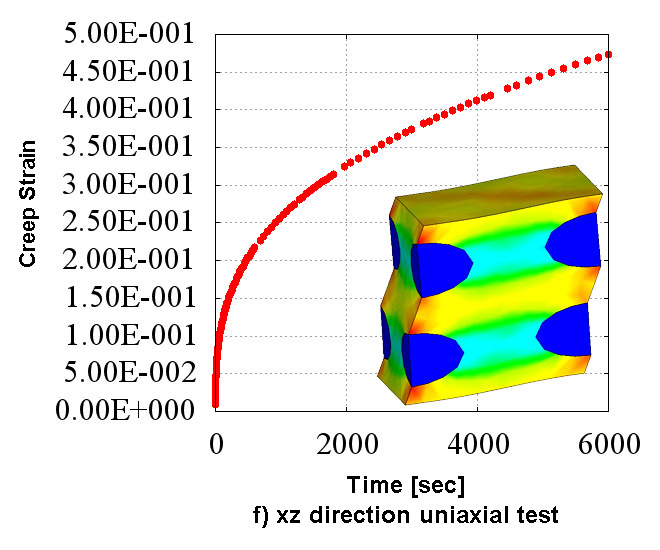
Figure 2.6. Results of Creep Numerical Material Test of Six Directions
Identification results
These are the identification results of anisotropic creep material properties based on the behavior of the numerical material testing which is calculated above. Figure 3 is a graph showing the convergence history of the error function that is minimized in the optimization algorithm. In this case, we define the difference between the response of the material constitutive law and material test results as the error function. You can achieve good convergence tendency without having special skills in CMAS since it has adopted Particle Swarm Optimization (PSO) and it is not necessary to specify the fitting parameters.
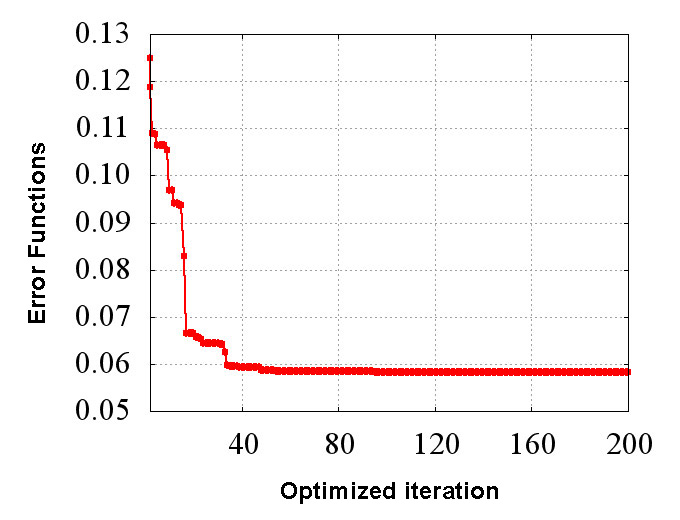
Figure 3. Error Functions History of Material Constant Identification by Optimized Analysis (Error functions is defined as the difference between the constitutive law response and material test response)
Figure 4 shows the convergence history of the material property value (Hill constant).
You can see that along with the increase in the optimized iterations, values converge on a certain constant material property value.
You can see that along with the increase in the optimized iterations, values converge on a certain constant material property value.
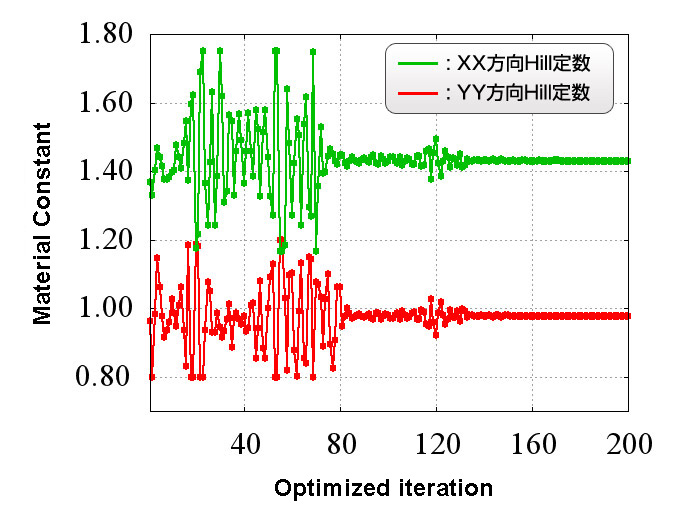
Figure 4. Material Constant Convergence History of Material Constant Identification by Optimized Analysis
Figure 5 shows a comparison of material test data and identification results.
You can verify the validity of the fitting results by comparing the two.
You can verify the validity of the fitting results by comparing the two.
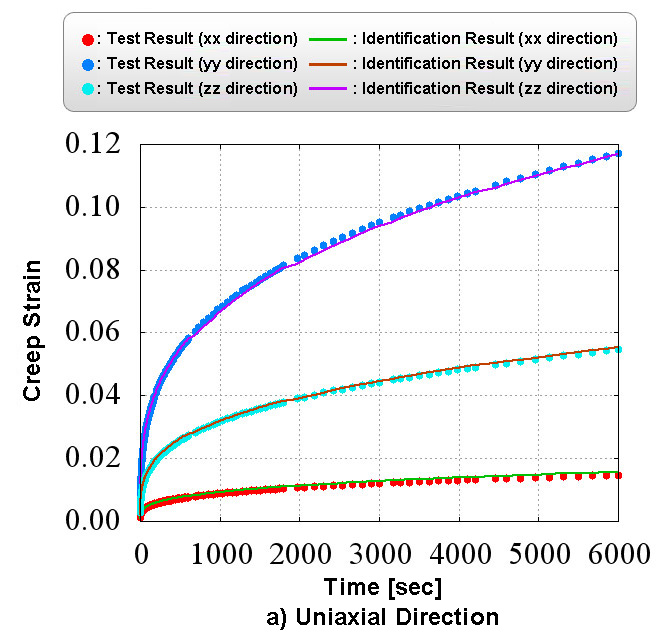
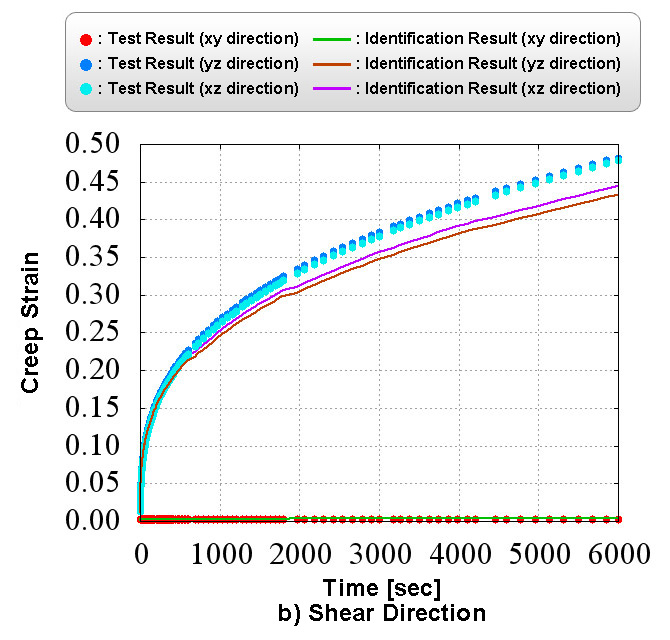
Figure 5. Material Constant Identification Results (Creep Characteristics)
Analysis Types
Structural Analysis、Mutiscale Analysis、Homogenization Analysis